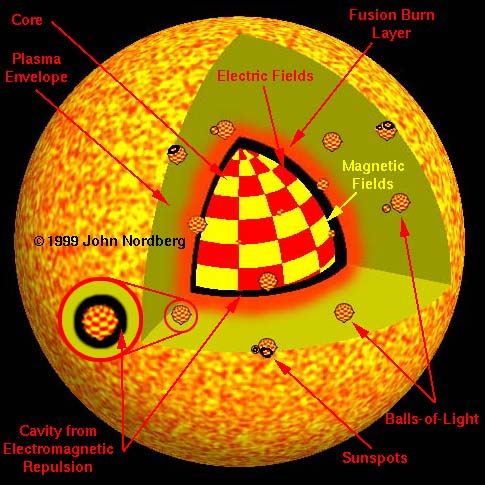
You might be asking, "What is the point of showing all of these patterns?" "Are they really important?" "Do they really relate to anything important in nature?" Obviously, I believe they do. Here is a specific example. I believe the cores of stars are very large elementary particles. My model for a star is shown in the following graphic.

I believe the core has a harmonic electric and magnetic field pattern on it as is crudely depicted in the following graphic.
If the core were to develop a nonharmonic pattern on it, which would cause it to explode, then such a pattern could be visible in the explosion.
The Hubble Space Telescope has imaged a planetary nebula that looks so much like one of these Spirograph patterns it is known as the Spirograph Nebula.

Beautiful! In my opinion, a visually obvious example of a decaying ball-of-light. Need more "proof"? Compare the pattern in this nebula to the following circular harmonic.

Is this a coincidence? Some computer trickery? I made this graphic almost 20 years ago. It has been just sitting around in my files, waiting for some astronomer to photograph a decaying star that looks like it.

This is a 2-dimensional circular harmonic that is decidedly 3-dimensional.

This pattern gives you a feel for how the core of star could be relatively harmonic while it is throwing off material in all directions.

Another pattern that gives you a feel for how the core of star could be relatively harmonic while it is throwing off material in all directions.

Another pattern that gives you a feel for how the core of star could be relatively harmonic while it is throwing off material in all directions.

Will we ever see a star explode like this? I doubt it.

This actually looks like a plasma explosion.

So cool I just had to include it. (I have about another 200 printouts I could scan.)